The job
The owner opens the card processor for sales, the accounting tool for cash, the booking system for next week, the inbox for enquiries and a spreadsheet for jobs. Each morning starts with a row of browser tabs and still no single picture. The owner's question: "How is the business doing today, this week and this month, on one screen?"
Trigger and outcome
Trigger: the owner wants one place to look. Outcome: a read-only dashboard with the handful of numbers the owner chooses (for example sales today and this week against last year, cash in the bank as of the last import, bookings next week, open enquiries, overdue invoices, open jobs). Each number links to its source and shows when it was last refreshed. Data is pulled on a schedule; the dashboard writes nothing back.
Tools
- Claude Code or Codex builds the data pulls (Square Orders, the Sheets API, Microsoft Graph for Excel or calendars, the accounting export) and the dashboard.
- Hermes sends a short morning summary from the same numbers and answers "why is this number different" by pointing at the source rows.
- Supabase Cron runs the scheduled pulls.
Steps
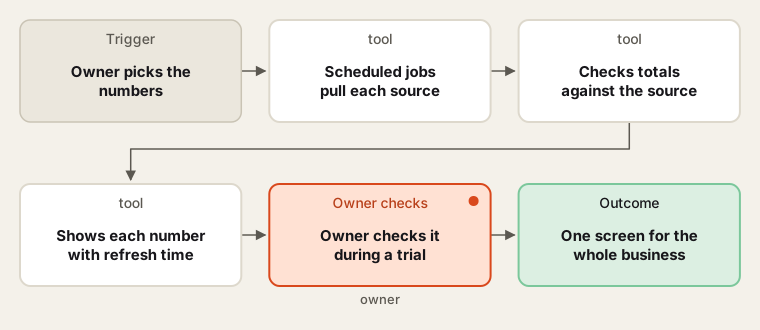
Each number shows where it came from and when.
- Pick the numbers. The owner chooses the numbers and the exact definition of each (for example "sales" before or after refunds). The intern writes the definitions on the dashboard itself.
- Connect. The coding agent writes one read-only pull per source, using read-only keys where the system offers them, on a schedule.
- Check. Each pull is tested against the source system's own report for the same period; differences are explained before the number goes live.
- Build the screen. One page, phone-friendly, each number with its refresh time and a link to the source. A stale pull shows as stale, not as zero.
- Trial and hand over. The owner uses it alongside the usual tabs for a trial period, then the intern hands over keys, the definitions page and a guide.
Human checks
- The dashboard is read-only; it never changes data in any system.
- Definitions are the owner's; the agent does not redefine a number to make it look better.
- Accounting figures on the dashboard are management figures; the accountant's figures win.
- Access is the owner's and named managers' only; keys live in the owner's accounts.
Data needed
The owner's list of numbers and read-only access to each system. Build with exports of invented data first.
Variations
- Weekly email: the same numbers as a Monday email.
- Targets: show each number against the owner's target.
- Manager view: a reduced dashboard for a site manager.
Where to find more
Further reading, not the source of this design:
- Square Orders API, Google Sheets API and Microsoft Graph for common sources.
- Supabase Cron for scheduled pulls.
Sources
- Square: Orders APIChecked 6 Oct 2026
- Google: Google Sheets API overviewChecked 6 Oct 2026
- Microsoft: Microsoft Graph overviewChecked 6 Oct 2026
- Supabase: CronChecked 6 Oct 2026
- Anthropic: Claude Code overviewChecked 6 Oct 2026